At this point, AgenticMediaLab has evolved into:
- ingestion systems
- async queues
- LangGraph orchestration
- embeddings
- trend ranking
- autonomous publishing agents
The infrastructure is becoming increasingly operational.
And operational systems require something critically important:
observability.
Because once AI systems begin running continuously, one question becomes unavoidable:
What is the system actually doing?
Without monitoring:
- failures become invisible
- token costs explode silently
- queues back up unnoticed
- workflows fail silently
- infrastructure degrades slowly
This is where:
- Prometheus
- Grafana
- metrics
- observability dashboards
become essential infrastructure layers.
In this article, we will build the first monitoring stack for AgenticMediaLab using:
- Prometheus
- Grafana
- Python metrics exporters
- AI pipeline observability
This is where the platform begins evolving into:
- a professionally monitored AI infrastructure system.
Why Observability Matters for AI Systems
Most AI tutorials focus on:
- prompts
- models
- APIs
But production AI systems increasingly require:
- operational visibility
- metrics
- tracing
- monitoring
- alerts
- failure detection
AI systems are becoming:
- distributed infrastructure.
Infrastructure requires observability.
What Should AI Systems Monitor?
Modern AI pipelines generate enormous operational complexity.
Examples include:
- token usage
- API latency
- queue depth
- workflow failures
- embedding generation time
- database performance
- publishing success rates
- retry counts
Without monitoring:
- scaling becomes dangerous.
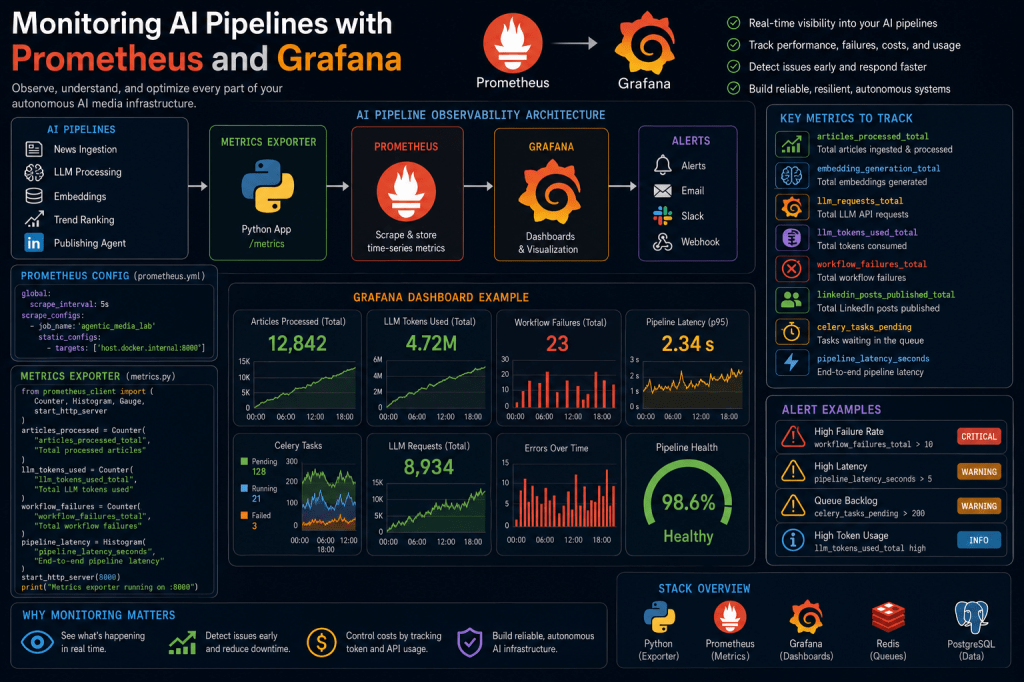
High-Level Monitoring Architecture
The new observability layer looks like this:
AI Workflows ↓Metrics Exporters ↓Prometheus ↓Grafana Dashboards ↓Alerts & Monitoring
This creates:
- operational visibility.
Why Prometheus?
Prometheus is one of the most widely used monitoring systems for:
- distributed infrastructure
- containers
- orchestration systems
- microservices
It specializes in:
- time-series metrics
- scraping metrics endpoints
- infrastructure observability
Prometheus becomes the:
- metrics collection engine.
Why Grafana?
Grafana provides:
- dashboards
- visualization
- operational analytics
- alerts
- infrastructure monitoring
It transforms raw metrics into:
- actionable operational intelligence.
Updating Docker Compose
Add Prometheus and Grafana services.
Update:
docker-compose.yml
Example:
prometheus: image: prom/prometheus ports: - "9090:9090"grafana: image: grafana/grafana ports: - "3000:3000"
Starting the Monitoring Stack
Run:
docker compose up
Docker now downloads:
- Prometheus
- Grafana
The observability layer is becoming operational.
Accessing Grafana
Open:
http://localhost:3000
Default credentials:
adminadmin
Grafana is now running locally.
Accessing Prometheus
Open:
http://localhost:9090
This becomes the metrics engine.
Repository Structure
Create:
observability/│├── metrics.py├── prometheus.yml├── dashboards/└── alerts/
This becomes the observability layer.
Installing Prometheus Client
Install Python exporter library:
pip install prometheus_client
Creating the First Metric
Create:
observability/metrics.py
Example:
from prometheus_client import Counterarticle_counter = Counter( "articles_processed_total", "Total processed articles")
This creates the first observable AI metric.
Why Metrics Matter
Metrics transform:
- invisible workflows
into:
- measurable systems.
Without metrics:
- debugging becomes guesswork.
Tracking Processed Articles
Example:
article_counter.inc()
Every processed article now becomes:
- operational telemetry.
Exposing Metrics Endpoint
Add:
from prometheus_client import start_http_serverstart_http_server(8000)
Prometheus can now scrape metrics from:
http://localhost:8000
Why Metrics Endpoints Matter
Prometheus continuously:
- polls metrics endpoints
- stores time-series data
- tracks infrastructure behavior over time
This creates:
- historical operational visibility.
Creating a Prometheus Configuration
Create:
observability/prometheus.yml
Example:
global: scrape_interval: 5sscrape_configs: - job_name: "agentic_media_lab" static_configs: - targets: - host.docker.internal:8000
This tells Prometheus:
- where metrics live.
Updating Docker Compose Again
Mount the config:
prometheus: image: prom/prometheus volumes: - ./observability/prometheus.yml:/etc/prometheus/prometheus.yml
Prometheus now loads:
- custom monitoring targets.
Example AI Metrics
The platform should eventually track:
articles_processed_totalembedding_generation_totalllm_requests_totalworkflow_failures_totallinkedin_posts_generated_totaltrend_scores_calculated_total
This creates:
- operational intelligence.
Tracking LLM Token Usage
Example:
from prometheus_client import Countertoken_counter = Counter( "llm_tokens_used_total", "Total LLM tokens consumed")
Usage:
token_counter.inc(1500)
Token observability becomes critical for:
- cost control.
Why AI Cost Monitoring Matters
Autonomous AI systems can generate:
- massive API costs
very quickly.
Without monitoring:
- runaway workflows
- infinite retries
- excessive summarization
become expensive operational problems.
Tracking Workflow Failures
Example:
failure_counter = Counter( "workflow_failures_total", "Total workflow failures")
Usage:
failure_counter.inc()
Now failures become:
- measurable infrastructure events.
Tracking Queue Depth
Celery queues should monitor:
- pending tasks
- worker saturation
- execution latency
Example metrics:
celery_tasks_pendingcelery_tasks_runningcelery_tasks_failed
This becomes:
- workflow observability.
Building the First Grafana Dashboard
Inside Grafana:
- add Prometheus data source
- create visualization panels
Example panels:
- articles processed
- LLM token usage
- workflow failures
- queue activity
- embedding generation latency
The system now becomes:
- operationally visible.
Example Dashboard Layout
AI Pipeline Health ↓Workflow Metrics ↓Queue Activity ↓LLM Usage ↓Publishing Metrics
This resembles:
- production infrastructure monitoring.
Why Dashboards Matter
Dashboards allow engineers to:
- detect failures
- identify bottlenecks
- optimize workflows
- understand scaling behavior
Observability becomes one of the most important disciplines in AI infrastructure.
Adding Alerts
Prometheus supports:
- threshold alerts
- anomaly detection
- infrastructure notifications
Example:
If workflow_failures_total > 10→ send alert
This creates:
- operational resilience.
Example Future Workflow
The architecture is evolving toward:
AI Workflows ↓Metrics Collection ↓Prometheus ↓Grafana Dashboards ↓Operational Alerts ↓Autonomous Recovery
The system is becoming:
- self-monitoring infrastructure.
Why Observability Is a Turning Point
This article marks a major architectural shift.
The platform is no longer simply:
- executing workflows
It is beginning to:
- observe itself.
This is foundational for:
- autonomous operational systems.
Common Beginner Mistake
Many AI projects ignore:
- monitoring
- metrics
- alerts
- observability
until systems fail in production.
But operational AI systems increasingly require:
- infrastructure-grade monitoring from the beginning.
Future Improvements
The observability layer will eventually support:
- distributed tracing
- anomaly detection
- AI workflow replay
- token cost forecasting
- automated failure recovery
- self-healing workflows
This moves toward:
- autonomous infrastructure management.
Why Observability Changes AI Engineering
Observability transforms AI systems from:
- opaque black boxes
into:
- measurable operational platforms.
This fundamentally changes how AI systems are engineered.
What Comes Next
The next infrastructure layers will introduce:
- autonomous retries
- self-healing workflows
- distributed agents
- semantic memory systems
- AI governance dashboards
- multi-agent orchestration
The platform is gradually evolving into:
- a fully operational autonomous AI infrastructure stack.
Final Thoughts
Monitoring is one of the most critical layers in modern AI systems.
Without observability:
- failures remain invisible
- scaling becomes dangerous
- infrastructure becomes unpredictable
By integrating:
- Prometheus
- Grafana
- metrics exporters
- operational dashboards
AgenticMediaLab now gains:
- infrastructure visibility
- operational intelligence
- measurable workflows
The platform is evolving from:
- AI experimentation
into:
- professionally operated autonomous AI infrastructure.
